
Abstract
- My goal was to measure the resistance of a dilute solution using tools available to me, and relate it to the solution’s concentration.
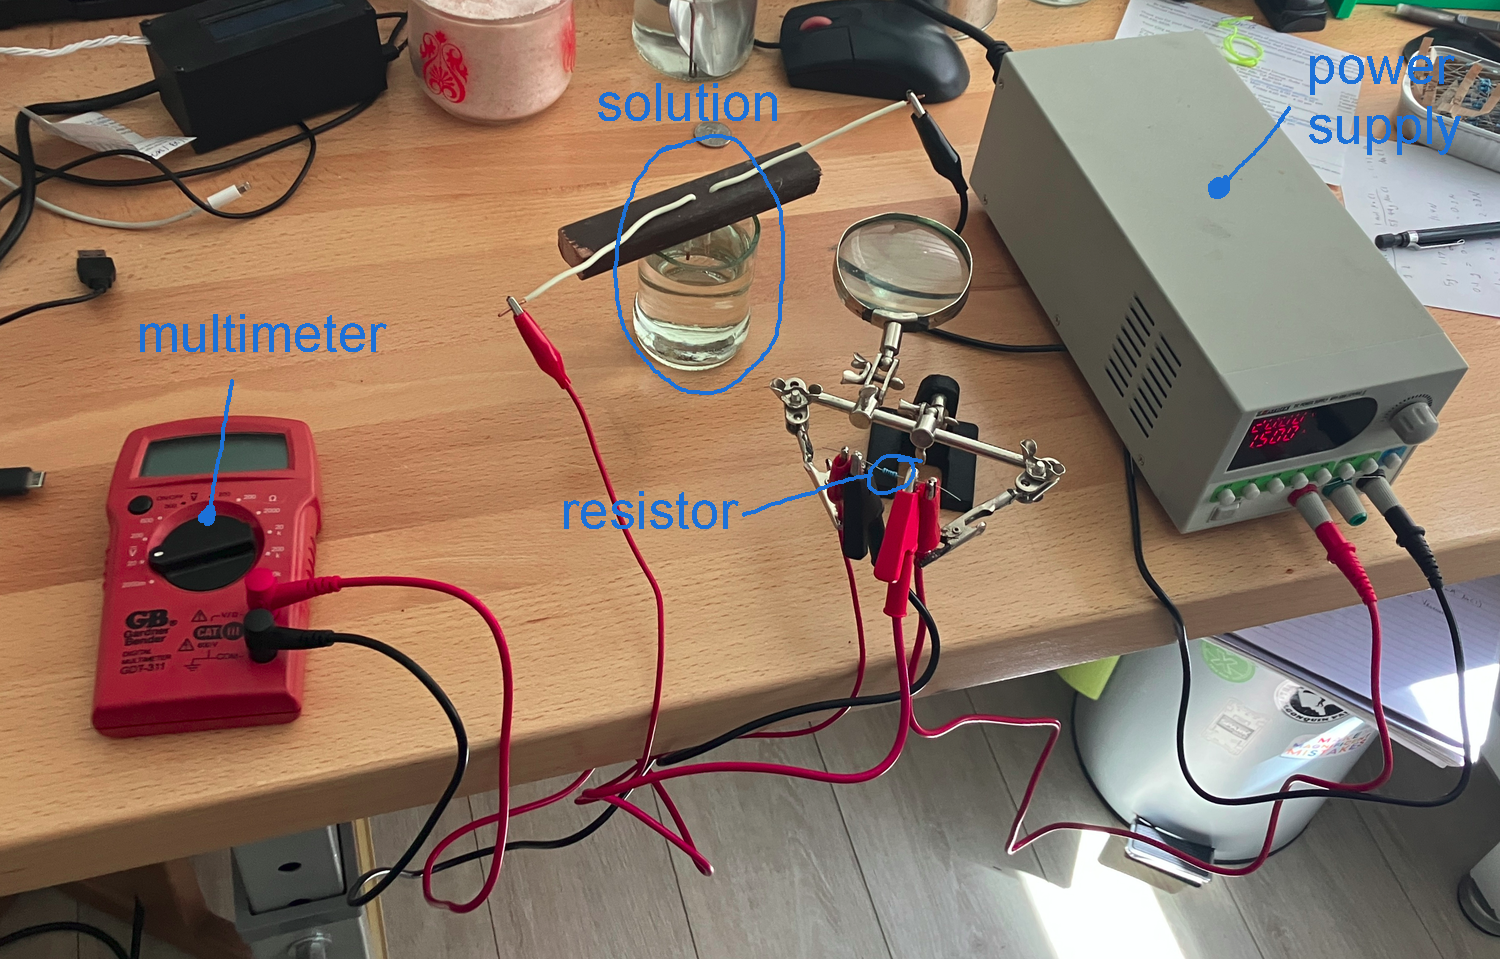
- A resistor was wired in series with the solution, and a DC power supply and a multimeter were used to measure the relative changes in input voltage and voltage across the resistor. This allowed the solution’s resistance to be calculated.
- I found a strong linear relationship between calculated resistance, and solution concentration.
Introduction
I was recently doing some more experiments with clay, which involved rinsing dissolved salts from a clay-water slurry. I wanted some way of measuring if most of the salt was gone, to avoid unnecessarily wasting water on additional rinsing.
In laboratories, a common way of doing this is to measure the conductivity of the rinse-water using a specialized (and expensive) conductivity meter. For consumer use, inexpensive total dissolved solids (TDS) meters exist to test drinking water salinity. However, for my purposes, I just need a simple way to estimate if more rinsing is needed, rather than a precise conductivity reading. I found that this can be done with just a DC power supply and a multimeter.
The Theory
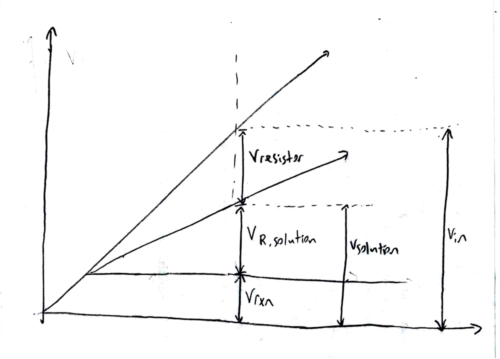
As direct current flows through a solution, charge from the power supply must participate in chemical reactions in order to flow from cathode to anode. These reactions remove (or add) a constant amount of energy to each charge, leading to a potential (i.e. voltage) difference between the anode and cathode. This voltage is more-or-less constant as input voltage varies.
The solution also has some internal resistance. Similar to ohmic materials, the solution will produce a resisting electromotive force (i.e. voltage) which is proportional to the current flowing through it. Extra voltage from the power supply is needed to overcome this electromotive force. Or, in a constant-voltage power supply, current will increase until supply voltage = reaction potential + resisting EMF.
Since the reaction potential is constant, it can be cancelled out by taking the difference between two measurements.
\( V_{in} = V_{rxn} + V_{resistance} = V_{rxn} + IR \newline
V_{in,1} – V_{in,2} = (I_1 – I_2)R \newline
R = \frac{ΔV_{in}}{ΔI}\)
Experimental Set-Up
I tested the conductivity of NaCl solutions ranging from 0 g/L (tap water) to 1.0 g/L. A conductivity probe was made using 14 AWG (1.6 mm ⌀) copper wires spaced 10 mm apart, with 10 mm of insulation stripped off each one; in this case, hydrogen was evolved at the cathode, and either copper hydroxide or copper (I) oxide was produced at the anode. I also tried replacing the copper with a stick of pencil-lead (graphite + clay, 2.0 mm ⌀), in which case hydrogen was produced at the anode and oxygen or chlorine at the cathode.
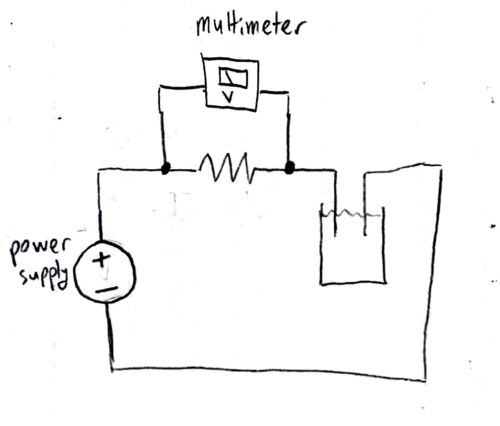
Measuring the tiny current through such a low-concentration high-resistance solution wasn’t possible with my multimeter. Instead, I used a voltage divider to compare the solution’s resistance with a known resistance, wiring a 10 kΩ or 1kΩ resistor (depending on the solution’s concentration) in series with the solution and measuring the voltage across the resistor. In such a setup, we would expect voltage across the resistor to remain at zero until input voltage reaches the reaction potential, and then increase linearly with input voltage.
\(V_{resistor} = (V_{in} – V_{rxn}) \frac{R_{resistor}}{R_{resistor} + R_{solution}} \newline
\frac{ΔV_{resistor}}{ΔV_{in}} = \frac{R_{resistor}}{R_{resistor} + R_{solution}} \newline
R_{solution} = R_{resistor}(\frac{ΔV_{in}}{ΔV_{resistor}} – 1)\)
For each test, I measured the voltage across the resistor at input voltages of 2, 4, 6, …, 32 V.
Results
A spreadsheet of all my data is here:
I measured a very strong linear relationship (R2 > 0.990) between the input voltage and the resistor voltage in all tests. The trend was broken when input voltage was less than reaction potential, so I ignored these measurements.
The solution resistance was calculated from the earlier formula \(R_{solution} = R_{resistor}(\frac{ΔV_{in}}{ΔV_{resistor}} – 1)\); and the reaction potential was calculated as the input voltage at which resistor voltage would be zero, according to the trend line. For the solution resistance calculation, I used the resistor’s measured value according to a multimeter, rather than its nominal value.
For example:

\(R_{solution} = 0.994\text{ kΩ}(\frac{1}{0.7551\text{ V/V}} – 1) = 0.322\text{ kΩ} \newline
V_{rxn} = -\frac{-1.1215\text{ V}}{0.7551\text{V/V}} = 1.49\text{V}\)
Copper vs. Graphite Anode
With both copper and graphite anodes, there was a strong linear trend between the solution’s concentration and its conductance (resistance-1), and reaction potential stayed fairly constant.


It’s interesting to note that the two anode materials give different conductance values. I think this can partially be explained by the larger diameter of the graphite electrode, and by the fact that it was uninsulated, giving it a larger area for conduction; according to the equation developed in this article, the cell constant of a parallel-wire probe can be calculated as
\( K = \frac{1}{π(\text{electrode length})} \ln(\frac{\text{electrode separation}}{\text{electrode radius}} – 1) \)
which says that conductance increases as the wire length and wire radius increase.
However, I’m not entirely sure that the difference in conductance is purely down to the geometry of the electrodes. It’s also possible that there’s some chemistry explanation, perhaps having to do with the ions produced by the electrolysis reactions.
Notes
- The probe’s resistance fluctuates a lot initially, particularly with a copper anode, and can take up to a few minutes to stabilize. Less fluctuation occurs if you change the input voltage without turning the power supply off; rather than turning it off before changing the voltage, and then on again.
- The probe should be kept still during measurements. Agitating it tends to increase measured resistance.
- There is a very slight difference in resistor voltage measurements, on the order of 0.1 V, depending on whether you slowly increase the input voltage, or decrease it. This has a small effect on the calculated reaction potential, and practically zero effect on the calculated resistance.
- If the copper-anode probe is run with one polarity, and then the applied voltage reversed, its reaction potential will temporarily be lowered. During this period, no gas is produced at the electrodes. I think this is due to the previous reactions reversing themselves to some extent, similar to how a rechargeable battery discharges.
Conclusion
I don’t know if the results I got for NaCl can be applied to other compounds. In any case, precisely determining solution concentration was not my goal. Rather, it was to evaluate the purity of rinse water.
For this purpose, generating a precise Vresistor vs. Vin curve is unnecessary; rather, one could just set Vin to 32 V, and compare the values of Vresistor in tap water, and rinse water. (Setting Vin higher makes the small variations in Vrxn negligible.) As the rinse water gets purer and purer, Vresistor in the rinse water will decrease to approach its value in tap water.
I prefer the graphite anode over the copper one because its produces a more stable reading, and because it doesn’t corrode during operation.
Commercially-produced solution conductivity meters apply a rapidly-alternating voltage, causing the ions to shuttle around between the two electrodes, so that the solution acts more like a capacitor with resistance. The applied frequency is high enough for the solution’s capacitive reactance to be negligible, so solution resistance is the only thing controlling the voltage-current relationship.