
Summary
- I performed various tests on my DIY greensand, both to evaluate the tests’ reliability, and also the sand’s characteristics
- A microscope showed that my sand was angular and had a wide range of particle sizes
- The tensile strength test showed my sand was much weaker than industrially-used greensands. After refining my procedure, I was able to get moderately reliable results
- The compactability test showed that my sand had a higher unrammed density than industry sands, and gave very reliable results.
- The shatter test showed that my sand was about as tough as industrial sands, and gave reliable results.
Introduction
Something I’ve struggled with a lot in my casting projects is sand tear-out, which is when pieces of sand get pulled out by the pattern as it’s withdrawn.
About a year ago, I conducted an experiment to measure the drawing force of a pattern from a greensand mold. The goal in that project was to identify print settings and release compounds that would reduce the force needed to draw a pattern from the sand, thus reducing the incidence of sand tear-out.
However, I realized that a bigger problem was my DIY greensand, which was a lot weaker and more friable that industrially-used foundry sands. Seeking a systematic way to improve my greensand, I first needed a way to quantitatively evaluate sands. That is the purpose of this project, in which I use readily-available materials to perform some of the same sand testing that is done in industry. Data from these tests are used to determine their reliability and repeatability, and also to compare my sand’s characteristics with those of industrial sands.
All of my results are contained in this spreadsheet:
Microscopy
The shape and size of the sand grains are important factors in determining a greensand’s characteristics. According to Foundry Sand Control by W. Davies, three factors should be noted:
- Size — Smaller grains make for a stronger and less permeable greensand.
- The ideal sand fineness depends on the material and geometry of the casting
- Grading — A wide distribution of particle sizes causes the sand to pack more densely than if it had uniform particle sizes, making if harder and stronger. However, such sands also have a steeper density gradient, which means that the effect of ramming penetrates less deeply into the mold; so though the sand is strong at the surface, it will be weaker in deep pockets and crevasses of the pattern.
- In general, it is desirable for sand to have a uniform size distribution.
- Angularity — Round sands are stronger and have less friable surfaces than angular sands.
- It is usually desirable for sand to be as round as possible.
Procedure and Results
I used a USB digital microscope to examine the sand grains from my DIY sand (mainly composed of play sand), and a bag of Basalite “30-mesh Industrial Sand”
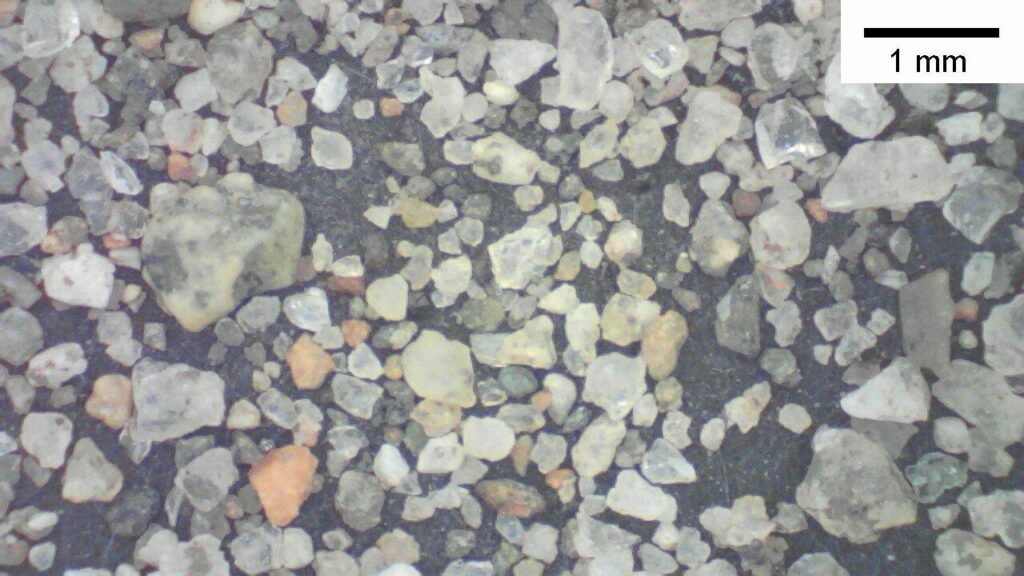
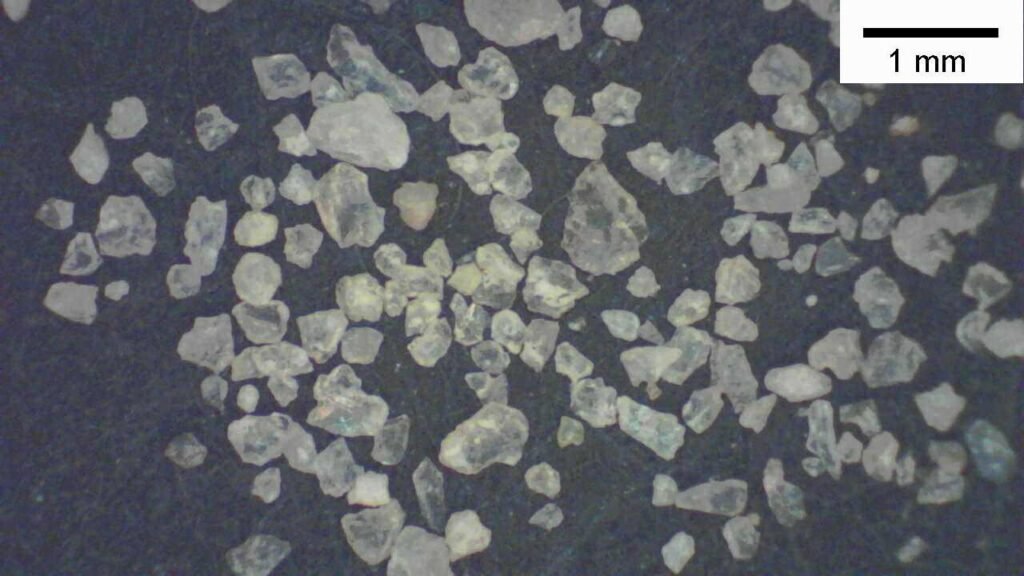
Both sands are mostly angular. Visually, it looks like the average particle size in both sands is about 0.4 mm. The industrial sand is fairly uniform in size with most particles between 0.2 and 0.5 mm, and a few unusually-large particles; while the play sand almost appears to be gap graded, with most particles either >0.6 mm or <0.3 mm. Also, judging from the color of the particles, the play sand appears to contain minerals other than silica.
The “industrial sand” is better suited for making greensand.
According to Davies,
“The great majority of high-silica sands used in foundries are so [uniformly] graded that 70 per cent. of the sand is retained by three, and often by only two, adjacent sieves of the bank defined on page 21. [1.00 mm, 0.70 mm, 0.50 mm, 0.35 mm, 0.25 mm, 0.21 mm, 0.15 mm, 0.10 mm.] The average grain size generally lies in the range 0.15 mm–0.50 mm.”
It looks as though, if both sands were sifted through a 40 or 50-mesh (0.4 or 0.3 mm) sieve, they would achieve the stated particle size and grading.
Side note: the meaning of “well-graded”
In Foundry Sand Control, the phrases “well-graded” and “poorly-graded” are used to refer to sands with, respectively, a narrow range and a wide range of particle sizes. However, in civil engineering and construction, the terminology is reversed, probably because a a wide-range sand is more desirable for its denser and stronger packing characteristics, and is thus called “well-graded”.
I think that the Foundry Sand Control terminology has become outdated; most modern sources on greensand that I found online do not use the terms “well-graded” or “poorly-graded” at all, but rather avoid the positive/negative connotations by saying “uniformly-graded” to describe the characteristic of a desirable sand. This is the terminology I chose for my blog article.
Tensile Strength
The most common way of measuring sand strength in commercial foundries is the compressive strength test. If the sand isn’t strong enough, it can tear out, due to the forces exerted in removing the pattern. However, Boenisch points out in his paper, “Recent thoughts on greensand control and mould production“, that insufficient tensile strength is a better predictor of sand tear-out; and that under certain conditions, factors detrimental to tensile strength don’t affect compressive strength, and thus cannot be detected in the compression test.
Procedure and Results
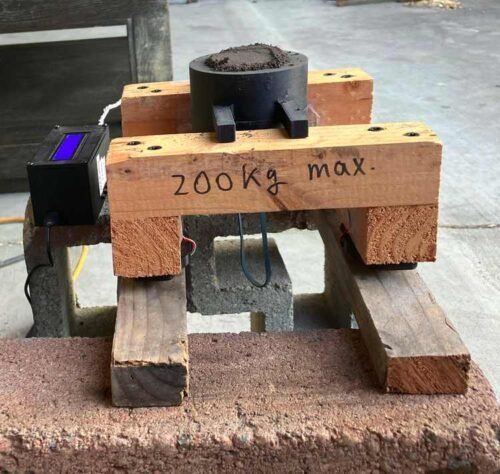
- Sand was rammed into a 3D-printed tensile-testing mold using a pine wood rammer weighing 131 g
- The top half of the mold was supported on a load cell
- The bottom half of the mold was pulled downwards by hand, until the sample broke
- The maximum force registered by the load cell was recorded
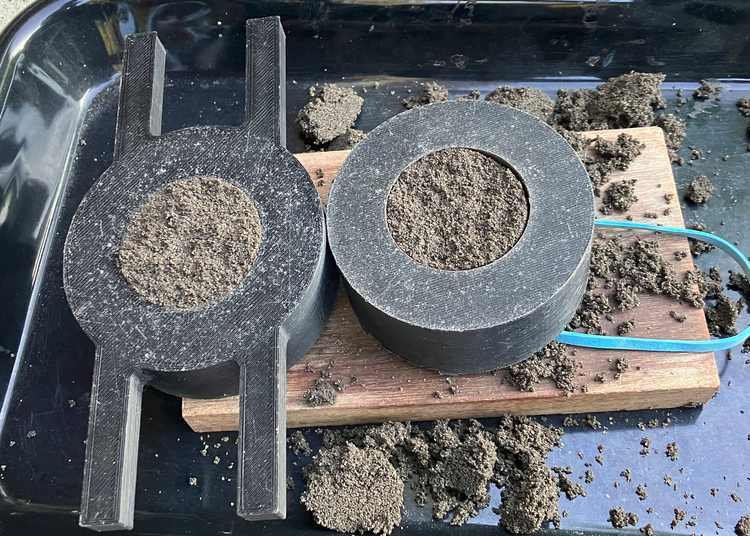
The mold used in my first trial is shown below. A piece of fishing-line was used to pull the sample. Across 32 trials, I calculated a mean strength of 6.1 kPa with a standard deviation of 1.4 kPa (24% of the mean). This means that about 25 trials are needed to reduce the standard error to less than 5% of the mean, to obtain a reasonably accurate result.
Thinking that the sharp corner at the sample’s break point might have caused a stress-concentration leading to inaccurate results, for my second iteration I re-designed the mold to be curved, mirroring industrial tensile-test specimens. Across 20 trials, I calculated a mean strength±SD of 4.28±0.66 kPa (±15% of the mean). For this setup, 9 trials are needed to reduce the standard error to ≤5%.
I did some more unstructured experimentation, and found that the amount of ramming has a large effect on measured strength. With 10 blows, the strength was around 3.6 kPa; with 30 blows it was about 6.3 kPa; and in one test of over 40 blows, I measured a strength of 7.4 kPa. The force of the blows also appeared to affect strength. Furthermore, I found that strength could be severely decreased if the rammer was allowed to strike the mold, instead of the sand — probably because this jars and shifts the mold, potentially cracking the sand.
Thus, for the third iteration I attempted to standardize the ramming procedure better, specifying that the sand should be packed into the mold as tightly as possible by hand, after which exactly 20 hard blows be hit with the rammer. To ensure the rammer not strike the mold, a small mound of sand was kept above the top of the mold. Also, to reduce errors caused by the load cell’s low sampling rate and moving-average smoothing being unable to accurately capture a rapidly-changing load, I pulled the mold through a rubber band to increase the load more slowly. Across 12 trials, the strength was calculated to be 6.04±0.45 kPa (±8%), which means that 3 trials are needed to reduce the standard error to ≤5%.
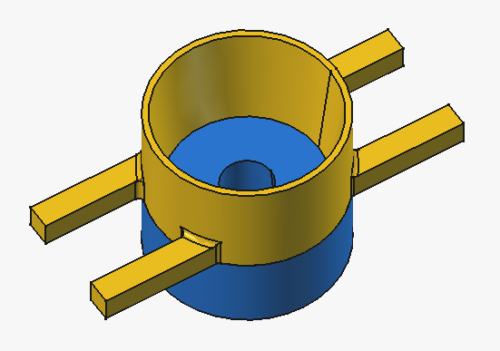
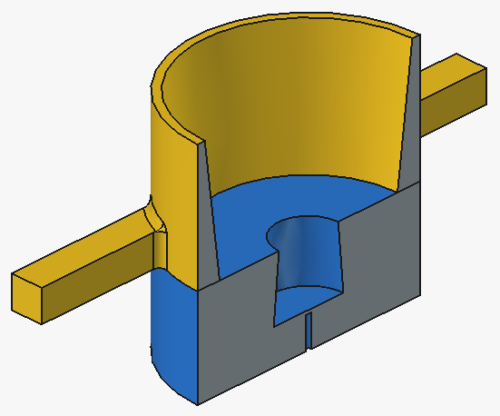
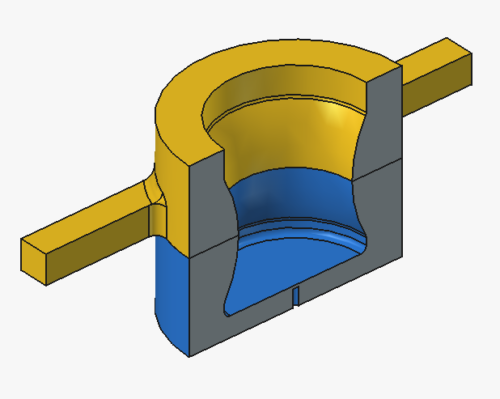
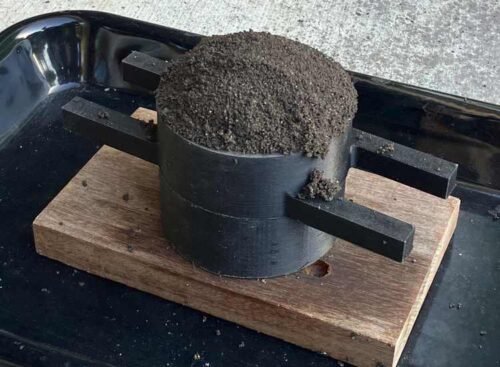
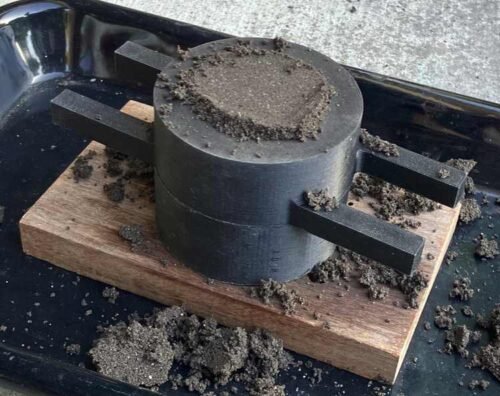
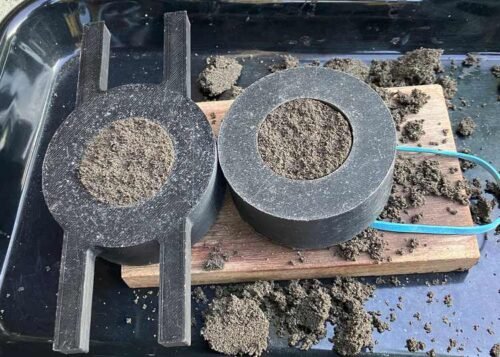
The difference in mean strength between these iterations is inconsequential to me, since it was most likely caused by changes in the sand’s water content. I’m most interested in reducing the variation between trials. Based on my testing, it seems like the curved mold and standardized ramming procedure (and possibly the rubber band) all contributed to a substantial reduction in error.
Another potential source of error is that misalignment between top and bottom halves of the mold might lead to a slight bending load on the sand, rather than a pure tensile load. The mold should be re-designed to include alignment features like alignment pins.
If we use the data in Boenisch’s paper as a reference, then the average sands used in industry should have a green tensile strength of ~13–20 kPa when compacted with the standard AFS 3-ram procedure (which is meant to approximate hand ramming). This is 2–3 times stronger than my sand — a very significant difference.
Compactability and Density
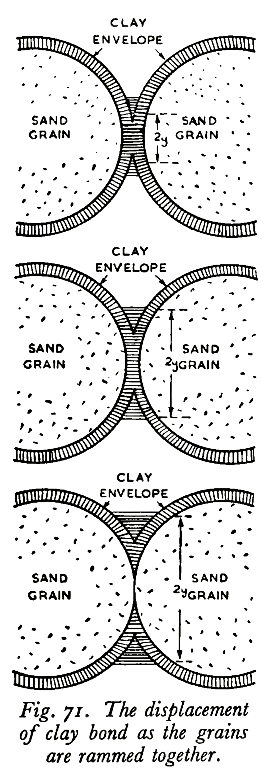
The compactability of greensand is an important indicator of its moisture content and clay content, which in turn affect the sand’s strength and plasticity. As moisture and clay content increase, the clay surrounding each sand grain expands, holding the sand grains further apart. This makes the riddled sand more “fluffy”, and decreases its density. When the sand is rammed, the sand grains are pressed together, and the clay is displaced to the gaps between sand grains. Since the density of rammed sand is more-or-less constant, the decrease in unrammed density results in a greater change in volume between rammed and unrammed samples — an increase in compactability.
Diagram source: Foundry Sand Control
Procedure
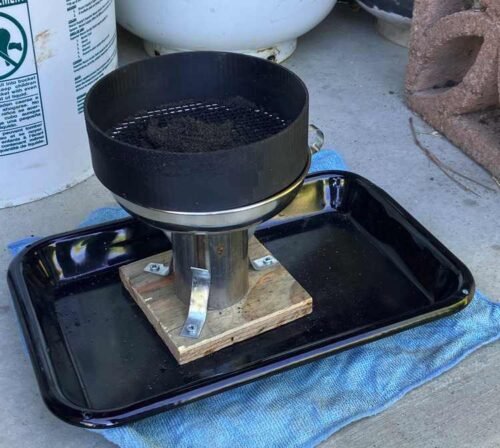
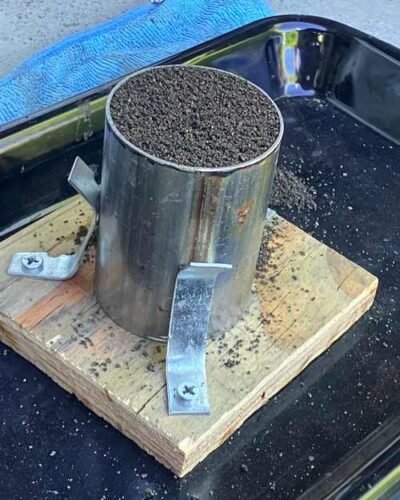
- A 3″-long (76.2 mm) piece of stainless steel tube was mounted on a plywood base by three spring clips
- Using a funnel and a 5-mm sieve, sand was riddled into the tube
- Excess sand above the tube was struck off with a butter-knife
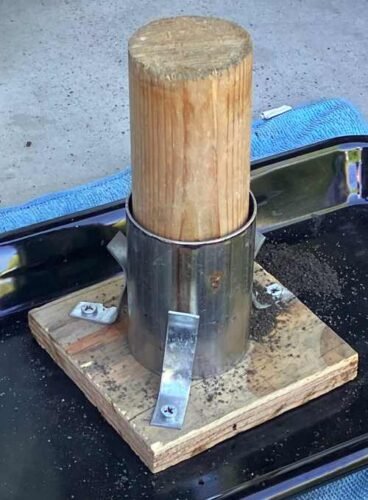
- A wooden dowel and a hammer were used to ram down the sand. Ramming proceeded until no further sand compaction was observed. Then a smaller rammer was used to further ram down any sand not compacted by the dowel.
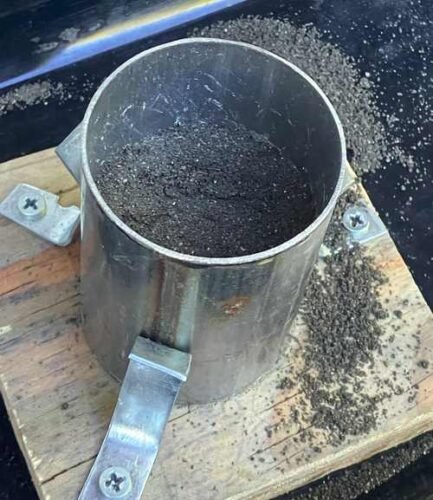
- The distance by which the sand was compacted was measured with a ruler
- It was found that measurements at different points along the tube’s inside perimeter differed by at most 1 mm.
- The whole apparatus (tube, base, and sand) was weighed
Results
Across 10 trials, I found that this test is extremely consistent. The calculated compactability, unrammed density, and rammed density values all had a standard deviation of 3% or less of the mean value.
The mean±SD values were:
- Compactability: 44±1%
- Unrammed density: 0.91±0.01 g/mL
- Rammed density: 1.65±0.04 g/mL
I also tried different ramming tools and techniques (still making sure to ram until no further compaction was observed) and found they had little effect on the results.
Looking at the graphs in Foundry Sand Control, it looks like commercial greensands usually have an unrammed density of about 0.6–0.8 g/mL at ideal water content, and a rammed density of about 1.3–1.6 g/mL. My sand’s high unrammed density is probably because it wasn’t mulled, causing the clay to be less evenly-distributed around the sand particles; and also probably because its water content deviated from ideal. I think the high rammed density is explained by my testing procedure, which states that the sand should be compacted as much as possible.
Different from my procedure, the standard AFS method for determining compactability specifies the sand be compacted by 3 rams, which implies that my compactability values cannot be directly compared to those in the literature.
Shatter Index
Another important factor causing sand tear-out is insufficient plasticity in the mold. Though the mold should not deform excessively to maintain its geometric integrity, some plasticity is desirable since it allows for some “wiggle room” when the pattern is removed. In a more plastic mold, the pattern can be rapped and rocked a bit to free it more easily; whereas in a brittle mold, such motions would break the sand.
Although the surest way to determine a sand’s plasticity is to measure its deformation under load, this is difficult due to how small the deformations are. In a graph from Foundry Sand Control, the deformation-at-failure on an “ideal” sand is indicated as about 3%, amounting to 1.5 mm on a standard 2-inch-tall compressive specimen.
An easier way to quantify a sand’s plasticity is the shatter test, where a sand specimen is dropped to shatter it, and then the size of the pieces analyzed. This works because a sand’s shattering characteristics are related to its toughness, which in turn is related to its strength and plasticity.
Procedure
The test apparatus consisted of:
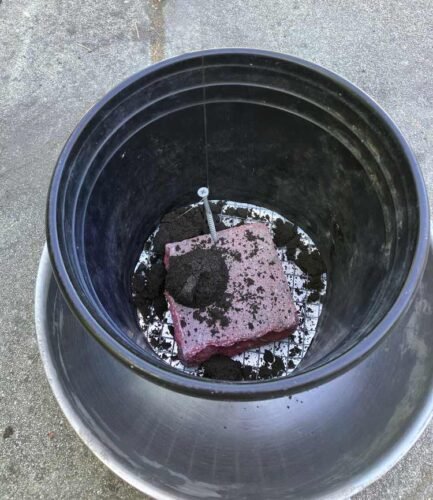
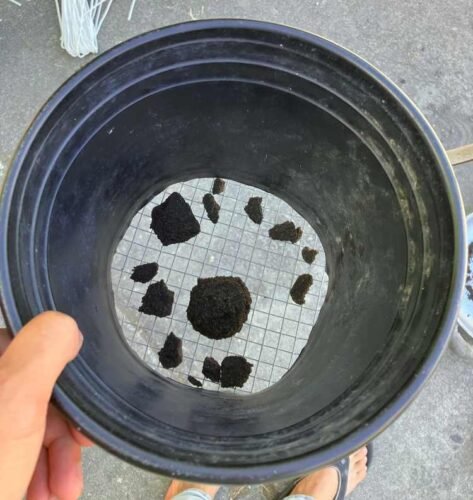
- A plastic bucket to contain the shattered sand; with wire mesh forming the bottom, to create a sieve
- A brick at the bottom of a bucket, making a hard surface for the sample to land on
- A pan under the bucket, to catch the small fragments of sand falling through the sieve
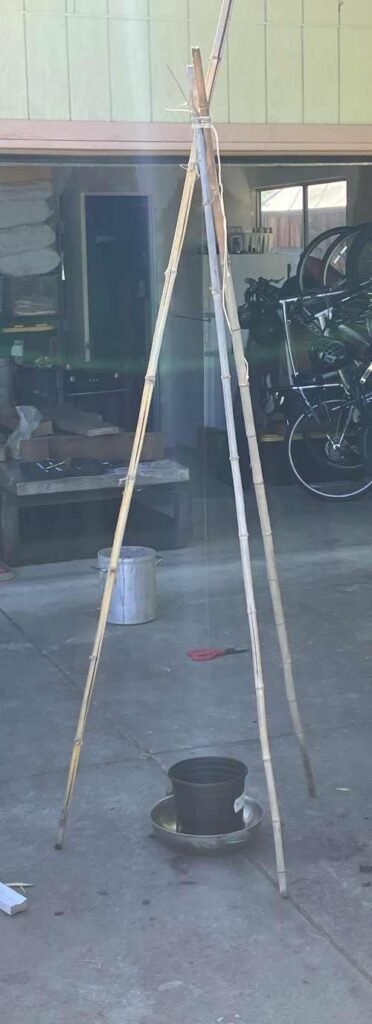
- A plumb-line suspended from a bamboo tripod, to mark where the sample should be dropped from, ensuring it lands directly on the brick.
The shatter test was conducted as follows:
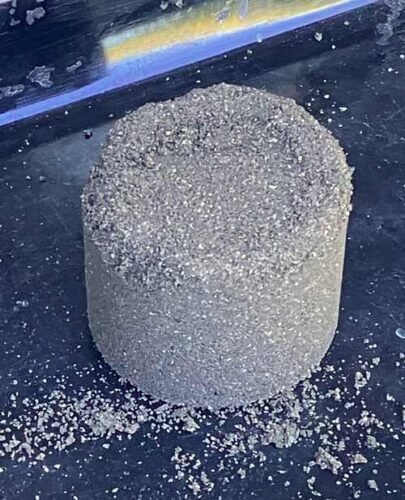
- The tube used for the compactability test (see above) was filled to the brim with sand. The sand was not riddled, though I did make sure to break up any large lumps of sand.
- The sand was compacted in the same manner as for the compactability test.
- The tube was removed from the base, and the sample of sand was ejected by pushing it out with the rammer.
- Any loose or crumbling bits of sand were scraped off the sample, and then the sample was weighed
- The sample was dropped, from a height of 6 feet (1.83 m), onto the brick
- Any adhering sand was gently scraped off the brick, and the brick was removed from the bucket
- The bucket was shaken gently to sift out small fragments of sand, while not breaking up the large fragments.
- The fragments of sand remaining on the sieve were removed and weighed
Results
I initially expected, given the seemingly-random nature of shattering, that the shatter test would have high variability. As it turned out, the standard deviation in calculated shatter index is pretty small — only about 5% of the mean. The mean shatter index±SD was 79.2±4.1.
According to Foundry Sand Control, average greensands in industry have a shatter index of 80–85, which is in line with what I measured in my sand.